vtune使用教程
安装部署
- Vtune可以重复安装试用,但要先卸载之前的版本。
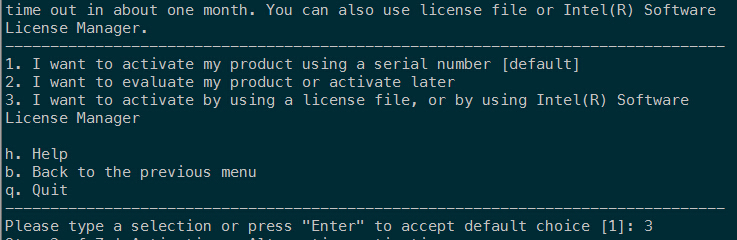
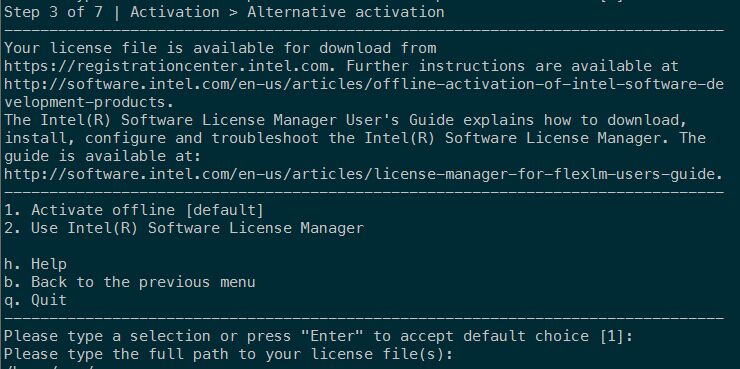
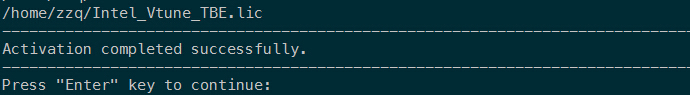
- 下面的”无效图片”是license文件,右键下载即可。
下载
从官网上下载intel-vtune-amplifier-xe的linux版本文件vtune_amplifier_xe_2015_update2.tar.gz解压
tar zxvf vtune_amplifier_xe_2015_update2.tar.gz
进入目录,执行安装脚本
#cd vtune_amplifier_xe_2015_update2#./install.sh
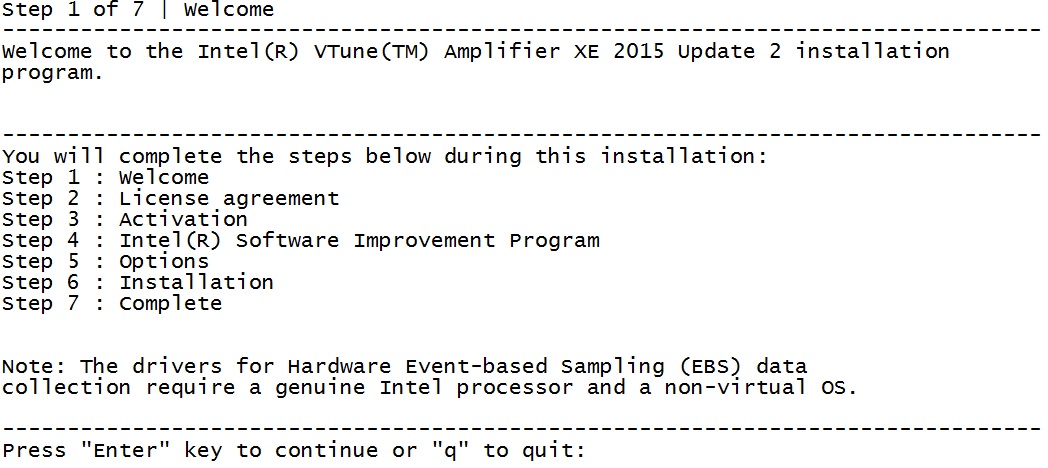
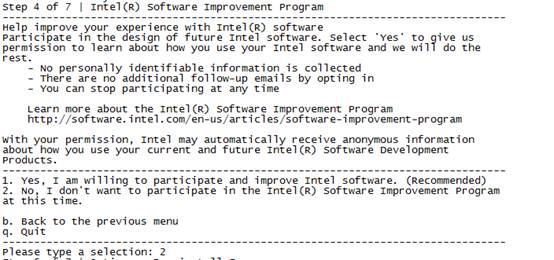
直接回车

敲入accept
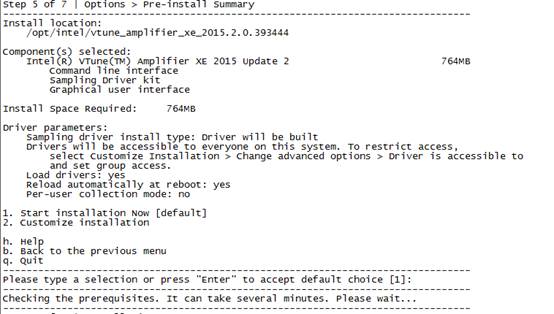
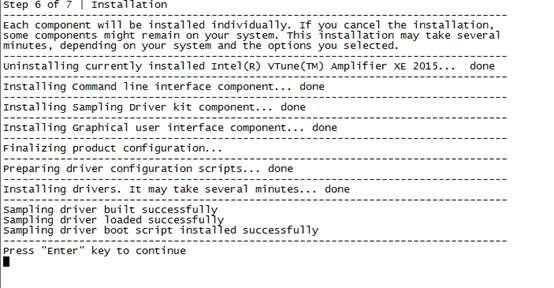
然后安装自动完成。
- 最后增加环境变量。运行#source /opt/intel/vtune_amplifier_xe_2015/amplxe-vars.sh
快速使用
首先通过file->new ->project .来创建一个project. 输入Project name和location.
- 之后会弹出一个配置Project Properties 的对话框,选择需要profile的对象target, 在这里提供了3中Target的类型:
- Launch Application, 在下面的Application中输入你要profile的应用程序,于是在后面开始profile的时候,VTune会启动这个应用程序。
- Attach to Process, 在下面的ProcessID中输入进程ID即可,主要针对的是已经启动的后台程序,VTune可以attach to Process对某一个时段的操作进行profile.
- Profile System,不需要选择target,直接对系统进程进行profile.
在配置完Project Properties之后,就可以选择new Analysis 图标,对这个project选择的target创建新的analysis. 可以针对一个project创建很多次的analysis。
在创建新的analysis时,需要选择analysis的类型,我只试过HotSpots这类型的分析类型,选择类型之后,就可以点击右边的start按钮开始profile工作了。
在完成profile时,点击stop按钮,就会结束profile,接着对profile的结构进行分析整理,以图表的形式展现出每个耗时的hotspot。
于是程序员就可以针对hotspot,进行有针对性的优化。
- 图形化结果说明:
- Summary
提供你的执行程序的一般信息。所用的时间包括执行程序线程的活动处理时间+cpu花在并行线程库上面的时间(如TBB和OpenMP)+cpu等待时间(spin time)
- Bottom-up
查看函数/模块/线程调用的时间耗费
- Caller/Callee
函数调用的时间
- Top-down tree
以树形结构展示每个调用所花费的时间及所占比,可以从时间花费最多的地方往下一层一层的展开,找到关键函数,分析其性能 补充说明,双击可以进入函数。加载后如果看不函数信息,需要添加路径。
教程1
如何着手使用VTune™ Amplifier XE针对你的项目进行性能调优,以及进行常规化自动测试 https://software.intel.com/zh-cn/blogs/2011/04/20/vtune-amplifier-xe-2
教程2
命令行分析语句 https://software.intel.com/zh-cn/blogs/2010/11/10/amplxe-cl/